Azure Synapse Analytics > Troubleshooting Query Performance with Synapse’s In-Flight Diagnostics
This blog article will guide users on how to perform in-flight query diagnostics in Synapse. During query performance diagnostics, it’s sometimes necessary to capture physical plan information from compute nodes. Currently, SQLDW has several mechanisms to obtain physical plans for different scenarios.
To capture all physical plans from all compute nodes for SQL queries and data movement after a query is completed, follow these steps:
- Run: set query_diagnostics on to turn on the session variable.
- Execute problematic query **(please use sqlcmd with -y0 option to avoid truncated plans)**
- The query will now return a result set of the plans from each distribution after each optimizable step. If the step is not optimizable, (i.e., if it does not go through QO) no plans will be returned for that step.
Example: Sqlcmd -S “dwtestsvrsouthcentralus.database.windows.net” -y0 -d TPCDS_10TB -U cloudSA_xlargerc -P dogmat1C -I -i .\GetQueryPlan.txt -o .\q67_output.txt
The following example is based on query diagnostics equal on and is executed within the session.
- Set query_diagnostics for:
- Run: set query_diagnostics off to turn off the session variable.
- DBCC PDW_SHOWEXECUTIONPLAN This is the scenario when there is a long running query in a specific distribution(s). The captured plan is the estimated plan.
- In T46, 5 DW passed through DMVs have been added to improve in-flight query performance diagnostics. This is also for debugging long running queries stuck in certain steps.
- dm_pdw_nodes_exec_sql_text
- dm_pdw_nodes_exec_query_plan
- dm_pdw_nodes_exec_query_profiles
- dm_pdw_nodes_exec_query_statistics_xml
- dm_pdw_nodes_exec_text_query_plan
Similar to SQL Server, Synapse SQL has several DMVs (Data Management Views) or DMFs (Data Management Functions) that provide insight into query execution. In Synapse, these are exposed as passed-through DMVs. To learn more about these DMVs and their details, please refer to the following links:
- https://learn.microsoft.com/en-us/sql/relational-databases/system-dynamic-management-views/sys-dm-pdw-nodes-exec-sql-text-transact-sql?view=azure-sqldw-latest
- https://learn.microsoft.com/en-us/sql/relational-databases/system-dynamic-management-views/sys-dm-pdw-nodes-exec-query-plan-transact-sql?view=azure-sqldw-latest
- https://learn.microsoft.com/en-us/sql/relational-databases/system-dynamic-management-views/sys-dm-pdw-nodes-exec-query-profiles-transact-sql?view=azure-sqldw-latest
- https://learn.microsoft.com/en-us/sql/relational-databases/system-dynamic-management-views/sys-dm-pdw-nodes-exec-query-statistics-xml-transact-sql?view=azure-sqldw-latest
- https://learn.microsoft.com/en-us/sql/relational-databases/system-dynamic-management-views/sys-dm-pdw-nodes-exec-text-query-plan-transact-sql?view=azure-sqldw-latest
Note: Keep in mind that the data returned by these DMVs can be substantial in systems with a high volume of queries. As a result, it’s essential to identify the specific step that’s causing the issue and drill down to the relevant node and session to query these DMVs.
Example of a trouble shooting script. It’s worth noting that you can modify the steps in the diagnostics process to suit your needs. By adjusting the steps, you can obtain more useful and targeted information for your specific scenario.
select * from sys.dm_pdw_exec_requests
where status = ‘Running’
order by submit_time desc
This step is crucial for identifying the specific query that needs to be troubleshooted. In this example, the query ID is QID1463796, and the problematic query is Query75 in Contoso.
To identify the step, add the following script:
select * from sys.dm_pdw_request_steps
where request_id = ‘QID1463796’
Step_index 15 is the result of the script:
select * from sys.dm_pdw_sql_requests
where request_id = ‘QID1463796’
and step_index = 15
In the following scenario, assume we need to trouble shoot spid 599
Note: Depending on the step, spid can be retrieved from sys.dm_pdw_sql_requests or sys.dm_pdw_dms_workers
The following script example is using sys.dm_pdw_dms_workers
select pdw_node_id, distribution_id, sql_spid, *
from sys.dm_pdw_dms_workers
where request_id = N'<QID>’
and step_index = 23
and [type] like ‘%READER%’;
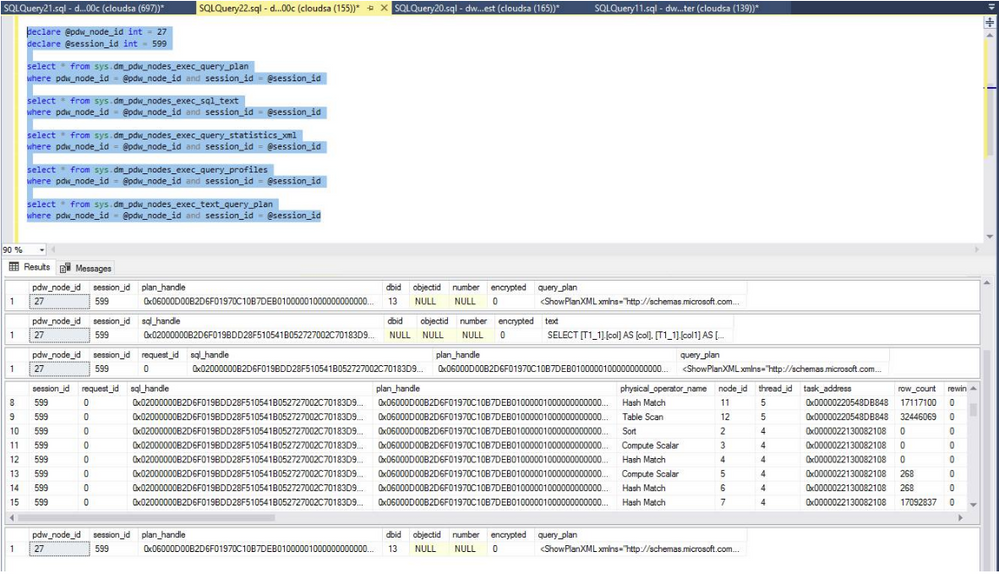
You can collect information from 1 dmv or multiple dmv(s). The following script example is to collect all information.
declare @pdw_node_id int = <node>
declare @session_id nvarchar(32) = <session>
select * from sys.dm_pdw_nodes_exec_query_plan
Where session_id = @session_id and pdw_node_id = @pdw_node_id
select * from sys.dm_pdw_nodes_exec_sql_text
Where session_id = @session_id and pdw_node_id = @pdw_node_id
select * from sys.dm_pdw_nodes_exec_query_statistics_xml
Where session_id = @session_id and pdw_node_id = @pdw_node_id
select * from sys.dm_pdw_nodes_exec_query_profiles
Where session_id = @session_id and pdw_node_id = @pdw_node_id
select * from
Where session_id = @session_id and pdw_node_id = @pdw_node_id
Because there is a limitation, SSMS truncates the output. It is recommended use sqlcmd with -y0 option to get it.
sqlcmd -S dwtestsvrscus.database.windows.net -d DwPerformanceTest -U cloudsa -P dogmat1C -I -i .\captureall.sql -o .\all.txt -y0
declare @pdw_node_id int = 14
declare @session_id int = 801

select * from sys.dm_pdw_nodes_exec_query_plan
where pdw_node_id = @pdw_node_id and session_id = @session_id

select * from sys.dm_pdw_nodes_exec_sql_text
where pdw_node_id = @pdw_node_id and session_id = @session_id
In conclusion, capturing the DSQL plan is a crucial step in optimizing query performance. By following the steps outlined above, we can effectively capture the plan and gain insights into node-level execution during query execution. This information provides us with valuable details that we can use to further investigate and optimize the query for improved performance.
It’s important to note that query optimization is an ongoing process, and with the right tools and techniques, we can continue to improve query performance and ensure efficient database operations. By taking advantage of tools like Synapse’s DMVs and following best practices for performance optimization, we can keep our systems running smoothly and ensure that our queries are performing optimally. So, keep refining your queries, and don’t hesitate to leverage the resources available to you to help achieve the best possible query performance.


